
I haven’t built a single report in HubSpot or Salesforce in at least six months.
That’s a weird thing for a RevOps guy to admit. Building reports is a function of the job (not the most important, but surely the most visible), or it was. Somebody asks where pipeline is, you go build the view, you save it to a dashboard, you send the link. I did that for fifteen years. When a client’s reporting was worth automating properly, I automated it: 95% of Pearl’s pipeline reporting, 15 hours a week back.
I stopped. And when I say it out loud on calls, the reaction is usually the same. People assume I mean I stopped caring about reporting. I didn’t. I care about it more now. I just don’t build the report anymore. And I spend SO much more time understanding the data.
News of my death has been greatly exaggerated
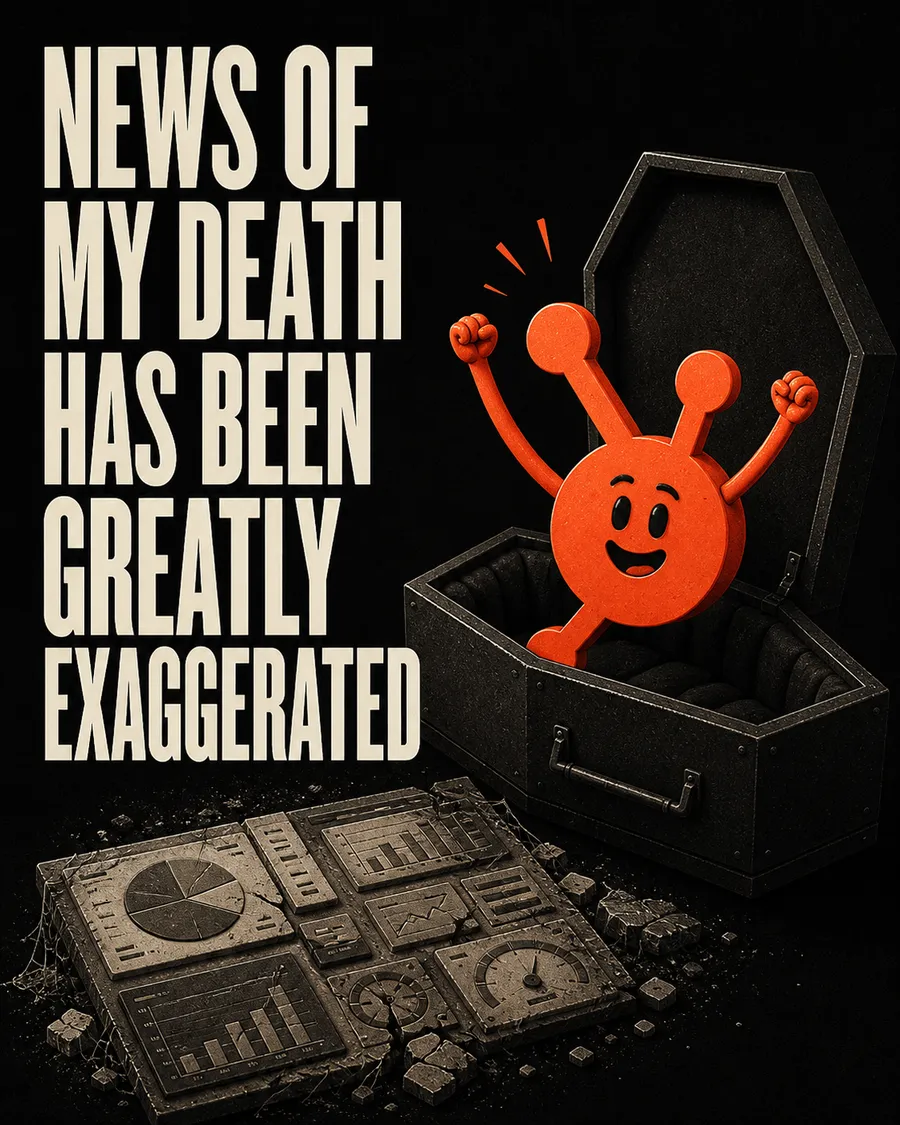
The take you see everywhere right now is that AI is going to kill the CRM. I think that’s hilarious.
You still need a system of record. Somebody has to own the answer to “who is this person, what did we sell them, and what happened after.” We need more accurate systems of record than ever. The data is more useful than ever and we can do more with it. An AI sitting on top of five disconnected tools doesn’t solve anything. But pointing it to a centralized CRM with everything you know about a prospect or customer and processes meant to clean and optimize it is insanely valuable.
So the CRM stays. Do they need to cost what they cost? Absolutely not. That’s a different fight and I’ll take that one all day. In fact, I have a whole post on how to piece together a diverse set of tools to avoid as many CRM costs as possible (but sneak peek, I’m still using HubSpot as the CRM…it starts at free).
The category that’s dying is the one I see very few posts about. In fact, I see people talking up upgrades to HubSpot’s reporting tools recently. 🤮 I’m done with BI tools. Domo, Looker, Tableau, Sisense, etc.
What a BI tool actually does for you
Strip it down. A BI tool does three things.
- It connects to your data sources.
- It gives you somewhere to define a query without writing SQL.
- It renders that query as a chart, on a schedule, in a place people can find it.
And every one of those three things got a lot cheaper in about eighteen months.
Here’s what I do instead. I point Claude at a data source I trust. I describe the question in plain English, the same way I’d describe it to an analyst. It hands me the artifact. If I want it weekly, I schedule it and it shows up weekly.
No dashboard to maintain. No chart that made sense in March and broke in June when somebody renamed a property. And you get it all without an expensive license and a UI only one person in the company really knows how to use.
A quick word before anybody tries this
The AI does not fix your data. If your close dates are wrong, if half your accounts are in there twice, if three people each have their own definition of a qualified lead, you’ll get a very confident looking chart built on garbage.
When I say I point it at a data source I trust, the “I trust” part is considerable. It’s potentially weeks or months of cleaning up properties, deleting fields nobody has filled in years, getting people to agree on what a stage actually means. Especially if that’s work no one has ever done. That’s one of many things I do for our clients.
So yes, clean the data first. Put data hygiene processes in place. Just don’t pay Domo $50k a year while you do it.
I’ve also simply noticed more engagement with these types of reports, both with myself and clients. A dashboard is a place you have to go. A report that lands in front of you demands your attention. I’ve actually gotten in the habit of sending an SMS to myself and clients to deliver my reports via Salesmsg (referral link, full disclosure, but I only refer tools I use myself).
Also, the experience is just better. Some BI tool reports don’t display well on phones or have UI elements surrounding the report itself that you can’t really get rid of. With something like this, you can deliver exactly what’s useful, no more or less.
Where I tell you to skip the warehouse
This might generate some push back, so let me take it head on.
I was on a call with a CS leader recently. They needed to report on churn and the data lived in three places. The instinct in that situation, and the instinct I traditionally would have encouraged, is that you, at some point, need a data warehouse to start connecting systems. I’m not at the point where I think they’re useless like BI tools. But I do think they’re overkill in many earlier stage scenarios now.
Here’s what I told them:
“I don’t really bother with data warehouses anymore, because I don’t really think you need them anymore, as long as you can describe the join key on what you’re trying to join. Because that’s ultimately the whole reason for a data warehouse is to find one consistent column across multiple tables. That’s, I mean, that’s not that complicated.”
A join key is just the one column that shows up in all three systems so you can line the rows up. An account ID, an email, a Stripe record number. A warehouse is a very expensive place to go do that job.
To be fair to warehouses, they do other stuff too. They keep history your CRM overwrites, so you can see what a record looked like in March instead of just what it looks like now. They let you run heavy queries without slowing down the system your reps live in. They give you audit trails and one agreed definition of a metric so finance and sales stop arguing about which number is right. Those are real reasons. They’re just not reasons that apply to most 100 person or less companies trying to generate a handful of reports that cross systems.
If you can name the column, you can probably skip the warehouse for now. If you can’t name the column, a warehouse won’t save you either. You’ve got a data problem, not an infrastructure problem, and buying infrastructure to solve a data problem is how you start blowing 6 figures on tools instead of building a better process.
It’s not just BI
The honest version of this is bigger than reporting.
“The number of software categories that it’s sort of just broken for me is ridiculous. Like I don’t touch Canva anymore. I don’t touch any BI tools anymore.”
Canva sitting next to Looker on that list is funny, but it’s the same story. Both of them were a tool for a task that used to require a specialist. When the specialist part got commoditized, the tool stopped being as relevant.
What I’d actually do about it
Three quick things you can do today.
Pull your BI renewal date. Just find out when it is. Then look at how many of the dashboards in there got opened in the last 30 days. If your tool can’t tell you that, ask a few people for honest feedback.
Pick your least important recurring report and rebuild it the other way. Not the board deck. Something small and weekly. Point an AI at the source, describe the question, schedule it. Run both versions side by side for a month and see if you or anyone else prefers the new version.
Before you do the data warehouse project, see if Claude/ChatGPT can generate what you need by specifying the join key (shared datapoint across systems). If you find yourself querying against multiple systems frequently, it might be time to consider the data warehouse. But if you’re building this sort of report just occasionally, this might be simpler.
The gut check
Think about the last report you shared around.
How many people opened it this month? Do you know? Ask them. And then build the custom AI version and see if it meets the need better.